


Lets look at the UK percentage of CO2 as we are always getting told that climate change appears to be on us, we need to do more, we need to spend trillions of pounds to fix the problem
UK Data
| Country | Code | Year | Percentage |
| United Kingdom | GBR | 1999 | 2.261662 |
| United Kingdom | GBR | 2000 | 2.231392 |
| United Kingdom | GBR | 2001 | 2.251109 |
| United Kingdom | GBR | 2002 | 2.134513 |
| United Kingdom | GBR | 2003 | 2.067438 |
| United Kingdom | GBR | 2004 | 2.003584 |
| United Kingdom | GBR | 2005 | 1.927333 |
| United Kingdom | GBR | 2006 | 1.855355 |
| United Kingdom | GBR | 2007 | 1.776416 |
| United Kingdom | GBR | 2008 | 1.700687 |
| United Kingdom | GBR | 2009 | 1.568931 |
| United Kingdom | GBR | 2010 | 1.536959 |
| United Kingdom | GBR | 2011 | 1.364 |
| United Kingdom | GBR | 2012 | 1.395364 |
| United Kingdom | GBR | 2013 | 1.3556 |
| United Kingdom | GBR | 2014 | 1.237254 |
| United Kingdom | GBR | 2015 | 1.191265 |
| United Kingdom | GBR | 2016 | 1.126424 |
| United Kingdom | GBR | 2017 | 1.075259 |
| United Kingdom | GBR | 2018 | 1.032802 |
| United Kingdom | GBR | 2019 | 0.984752 |
| United Kingdom | GBR | 2020 | 0.931975 |
| United Kingdom | GBR | 2021 | 0.943774 |
| United Kingdom | GBR | 2022 | 0.857756 |
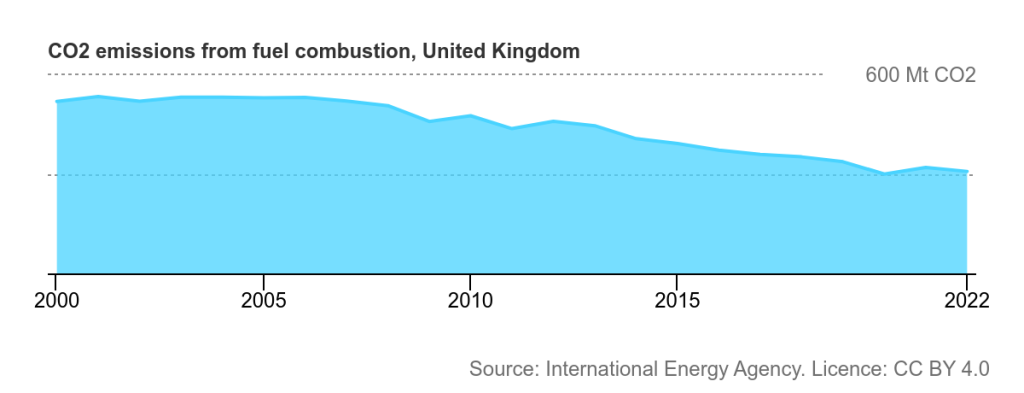
Now lets look at this data in terms of CO2 emissions over the same time period
| Country | Code | Year | Annual CO2‚ emissions |
| United Kingdom | GBR | 1999 | 2.261662 |
| United Kingdom | GBR | 2000 | 2.231392 |
| United Kingdom | GBR | 2001 | 2.251109 |
| United Kingdom | GBR | 2002 | 2.134513 |
| United Kingdom | GBR | 2003 | 2.067438 |
| United Kingdom | GBR | 2004 | 2.003584 |
| United Kingdom | GBR | 2005 | 1.927333 |
| United Kingdom | GBR | 2006 | 1.855355 |
| United Kingdom | GBR | 2007 | 1.776416 |
| United Kingdom | GBR | 2008 | 1.700687 |
| United Kingdom | GBR | 2009 | 1.568931 |
| United Kingdom | GBR | 2010 | 1.536959 |
| United Kingdom | GBR | 2011 | 1.364 |
| United Kingdom | GBR | 2012 | 1.395364 |
| United Kingdom | GBR | 2013 | 1.3556 |
| United Kingdom | GBR | 2014 | 1.237254 |
| United Kingdom | GBR | 2015 | 1.191265 |
| United Kingdom | GBR | 2016 | 1.126424 |
| United Kingdom | GBR | 2017 | 1.075259 |
| United Kingdom | GBR | 2018 | 1.032802 |
| United Kingdom | GBR | 2019 | 0.984752 |
| United Kingdom | GBR | 2020 | 0.931975 |
| United Kingdom | GBR | 2021 | 0.943774 |
| United Kingdom | GBR | 2022 | 0.857756 |
So let me summarise this in laymens terms – the UK is doing a lot to lower emissions, to be told otherwise is a lie.
Since 1999 – we have went from 2.261662 to 0.857756. More than halved our output.
So its costing the UK taxpayers a huge amount of money and contrary to activists like Just Stop Oil, Greenpeace and the Green Party the UK is not the issue, we are trying again to solve a problem and we are solving it.
So why don't they protest some of the countries and organizations – I'll leave that up to yourselves to figure that out, it seems fairly obvious.
We will look at other countries in the world and yes the data is available